Overview on Water Conservation
Introduction
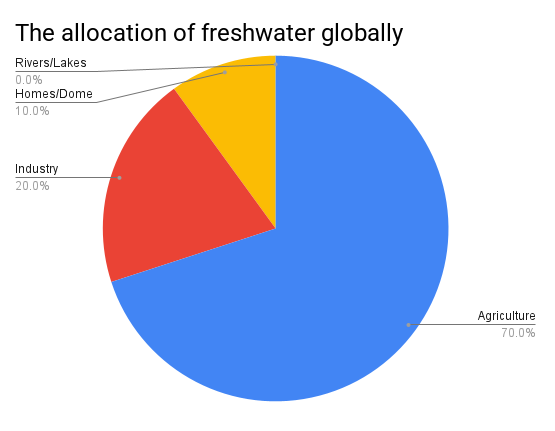
Water keeps our food growing, lights on, and homes running; but the freshwater we can actually use is limited. Globally, about 70% of withdrawals go to agriculture, ~20% to industry, and ~10% to homes. Most of Earth's water is salty; of the tiny slice that's fresh, only a fraction of 1% sits in rivers and lakes we can tap. Meanwhile, demand has surged with population and lifestyle changes.
In many regions aquifers are sinking, rivers run low, and ecosystems are stressed. When we waste water in crops, factories, or kitchens, the impacts ripple outward from wildlife to food prices to community health.
This article unpacks where water goes (especially food and industry), why overuse is a problem, and how you can help. Small choices — from what we eat to fixing leaks — add up to big savings when millions of people do them.
🌾 Food and agriculture: virtual wate 🌾
Agriculture is the world's largest water user, taking about 70% of freshwater withdrawals. But most of that water is "invisible" to us, it's virtual water, the hidden amount needed to grow and produce our food.
Virtual water is the hidden water used to grow and make the food and products we use every day.
Example: A hamburger despite its small stature "contains" about 2,500 liters of water when you count the water used to grow the cow's feed and process the meat. Think of virtual water as the "invisible ingredient" in everything we buy and eat, if you know about it helps us make smarter choices!
Some everyday favorites have surprisingly large water costs:
- Almonds: 12 L of water per nut: eating a handful (say 10 nuts) uses as much water as running a faucet for 2 minutes straight.
- Avocado: ~227 L each: roughly equal to taking a 5-minute shower with a low-flow showerhead.
- Coffee: ~130 L per cup: that's about the water used to flush a toilet five times.
Beef remains the heavyweight: producing 1 kg of beef can require about 15,000 L of water (a single burger: ~2,500 L). Plant foods like grains and beans use far less. Lentils, for example, need around 6,000 L per kg, still much lower than beef.
Overall, half your personal water footprint comes from food, mostly meat and dairy. Plus, about one-third of food is wasted, and so is all the water that grew it.
By swapping some meat meals for plant-based ones and cutting food waste, you can save thousands of liters of water each week, enough to keep rivers fuller and help communities in water-scarce regions.
⚠️ Why water usage is a serious issue ⚠️
Freshwater is scarce and unevenly distributed. Overuse and waste lead to serious global problems:
1. Rivers dry up, aquifers drop, and half the world's population faces severe water scarcity part of the year. Cape Town's 2018 "Day Zero" crisis is a warning that even major cities can suffer, in which Cape Town was heading to a day where they wouold almost ran out of water to drink in 2017-18.
2. About 2.2 billion people lack safe drinking water. Women and girls spend 200 million hours daily collecting water, taking time away from school and work.
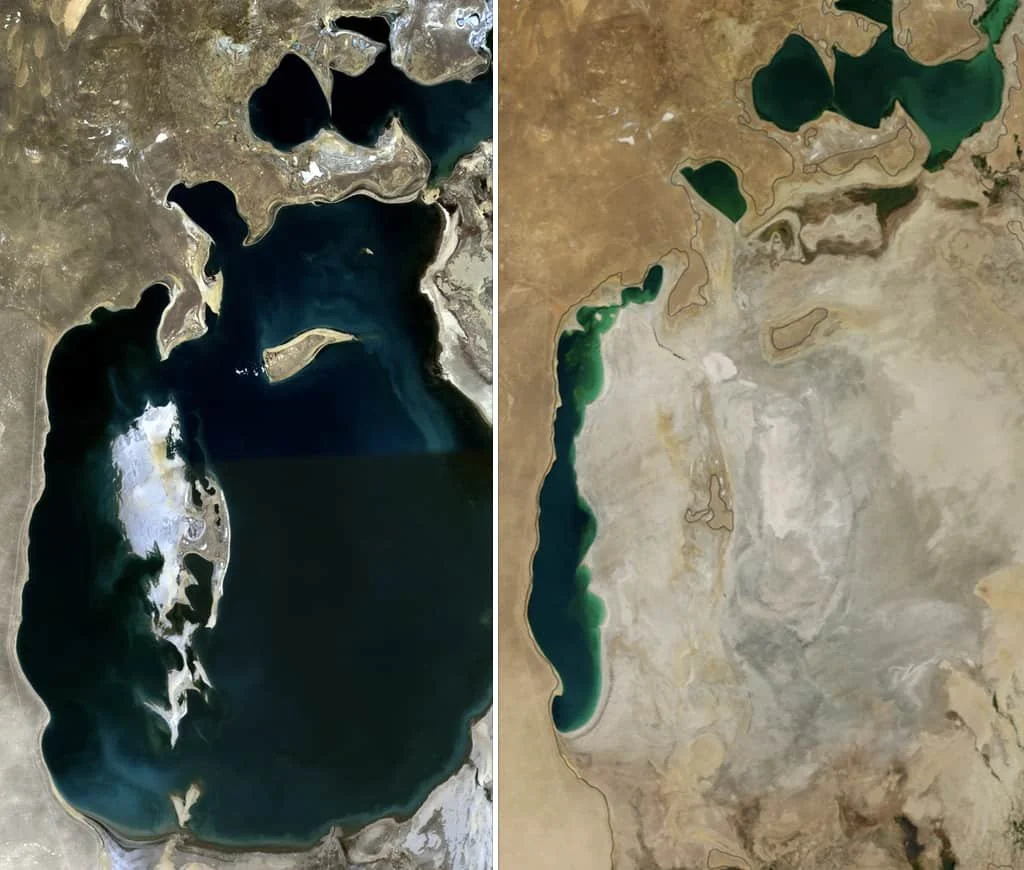
3. Overuse dries wetlands and kills ecosystems. The Aral Sea shrank by 90%, wiping out fisheries, and the Colorado River now rarely reaches the ocean.
4. Wealthy nations import water-intensive goods (like beef and cotton) from dry regions, worsening shortages and creating tension over shared water.
Graphs of water usage

Examples of decrease of Water Usage
Aral Sea (Central Asia)
Once the world's 4th largest lake, it nearly dried up because rivers were overused for cotton farming.
Colorado River Basin (United States)
The Colorado River Basin has seen a decrease in water supply of over 27.8 acres and water flow has decreased 20% over the last century.
Ogallala Aquifer (United States)
One of the biggest underground water sources, being drained too fast for farming in states like Texas and Kansas.
Lake Chad (Africa)
Shrunk by more than 90% since the 1960s due to irrigation, overuse, and climate change, leaving millions struggling for water.
🗺️ Interactive Water Crisis Map 🗺️
Hover over highlighted countries to see affected water bodies
💧 Our Mission
This website grew from a love of environmental science and a deep worry about how we treat our planet's most precious resource: water. It's not a giant nonprofit or a donation campaign — it's a passion project. A space to learn, reflect, and maybe even have a little fun while exploring the hidden story of water in our everyday lives.
I'm a high school student, so this is a small-scale effort — but small doesn't mean powerless. Big change often starts with simple ideas shared in unexpected places. If you leave here knowing one new fact, or feeling a bit more curious about the water behind your food, your clothes, or even your morning coffee, then this project has done its job.
Water connects all of us. Together, if we value it more and waste it less, those small ripples can grow into waves of change. 🌊
Works Cited
Food and Agriculture Organization of the United Nations. AQUASTAT Main Database. FAO, https://www.fao.org/aquastat/. Accessed 26 June 2026.
Food and Agriculture Organization of the United Nations. The State of Food and Agriculture 2019: Moving Forward on Food Loss and Waste Reduction. FAO, 2019, https://www.fao.org/3/ca6030en/ca6030en.pdf. Accessed 26 June 2026.
NASA Earth Observatory. "World of Change: The Aral Sea." NASA, https://earthobservatory.nasa.gov/world-of-change/AralSea. Accessed 27 June 2026.
National Aeronautics and Space Administration. "Lake Chad." NASA Earth Observatory, https://earthobservatory.nasa.gov/. Accessed 3 July 2026.
United Nations Educational, Scientific and Cultural Organization. United Nations World Water Development Report 2024: Water for Prosperity and Peace. UNESCO, 2024, https://www.unesco.org/reports/wwdr/. Accessed 3 July 2026.
UNICEF. "Water, Sanitation and Hygiene (WASH)." UNICEF, https://www.unicef.org/wash. Accessed 3 July 2026.
United States Geological Survey. "The Water Cycle." USGS Water Science School, https://www.usgs.gov/special-topics/water-science-school. Accessed 7 July 2026.
United States Geological Survey. "High Plains (Ogallala) Aquifer." USGS, https://www.usgs.gov/. Accessed 7 July 2026.
United States Bureau of Reclamation. "Colorado River Basin." U.S. Department of the Interior, https://www.usbr.gov/colorado/. Accessed 7 July 2026.
Water Footprint Network. "Product Gallery." Water Footprint Network, https://waterfootprint.org/en/resources/interactive-tools/product-gallery/. Accessed 8 July 2026.
World Health Organization and United Nations Children's Fund. Progress on Household Drinking Water, Sanitation and Hygiene 2000–2022: Special Focus on Gender. WHO and UNICEF Joint Monitoring Programme, 2023, https://washdata.org/. Accessed 8 July 2026.